
How to Verify BV Pixel
This page describes how to confirm that BV Pixel data is being captured correctly and sent to Bazaarvoice.
Overview
You can test your BV Pixel solution using the Bazaarvoice Analytics Inspector for Chrome or the Bazaarvoice Workbench.
Verify in the browser
After downloading the Bazaarvoice Analytics Inspector for Chrome, you can see the analytic events as they occur on the page in near real time. Read about the sample website and test that the extension is working correctly by visiting the sample PDP or the sample transaction page. Values and events are displayed in the extension tool.

Product display page analytics
Test an event on a PDP:
-
Load the page, which causes the Pageview event to fire. Expand the 'PageView' under Event Counts to see details of what has been captured.
-
When you scroll down to Bazaarvoice UGC on the page, an InView event should fire. Expand Feature under Event Counts to see more details.
-
If the Bazaarvoice UGC is in view for at least five seconds, a ViewedUGC event should fire. Click on Feature under Event Counts to see more details.
-
When you interact with UGC (e.g. sort, filter, click, hover), a UsedFeature event should fire. Click on Feature under Event Counts to see more details.
It is possible that the InView count is 2 because the user scrolled down to Ratings and Review and Questions and Answers on a page. When users interact with the UGC, additional UsedFeature events are captured; the user clicked to ask a question (Ask), clicked to write a review (Write), closed the submission form
(Close), and used a filter (Filter).
Conversion / Transaction events
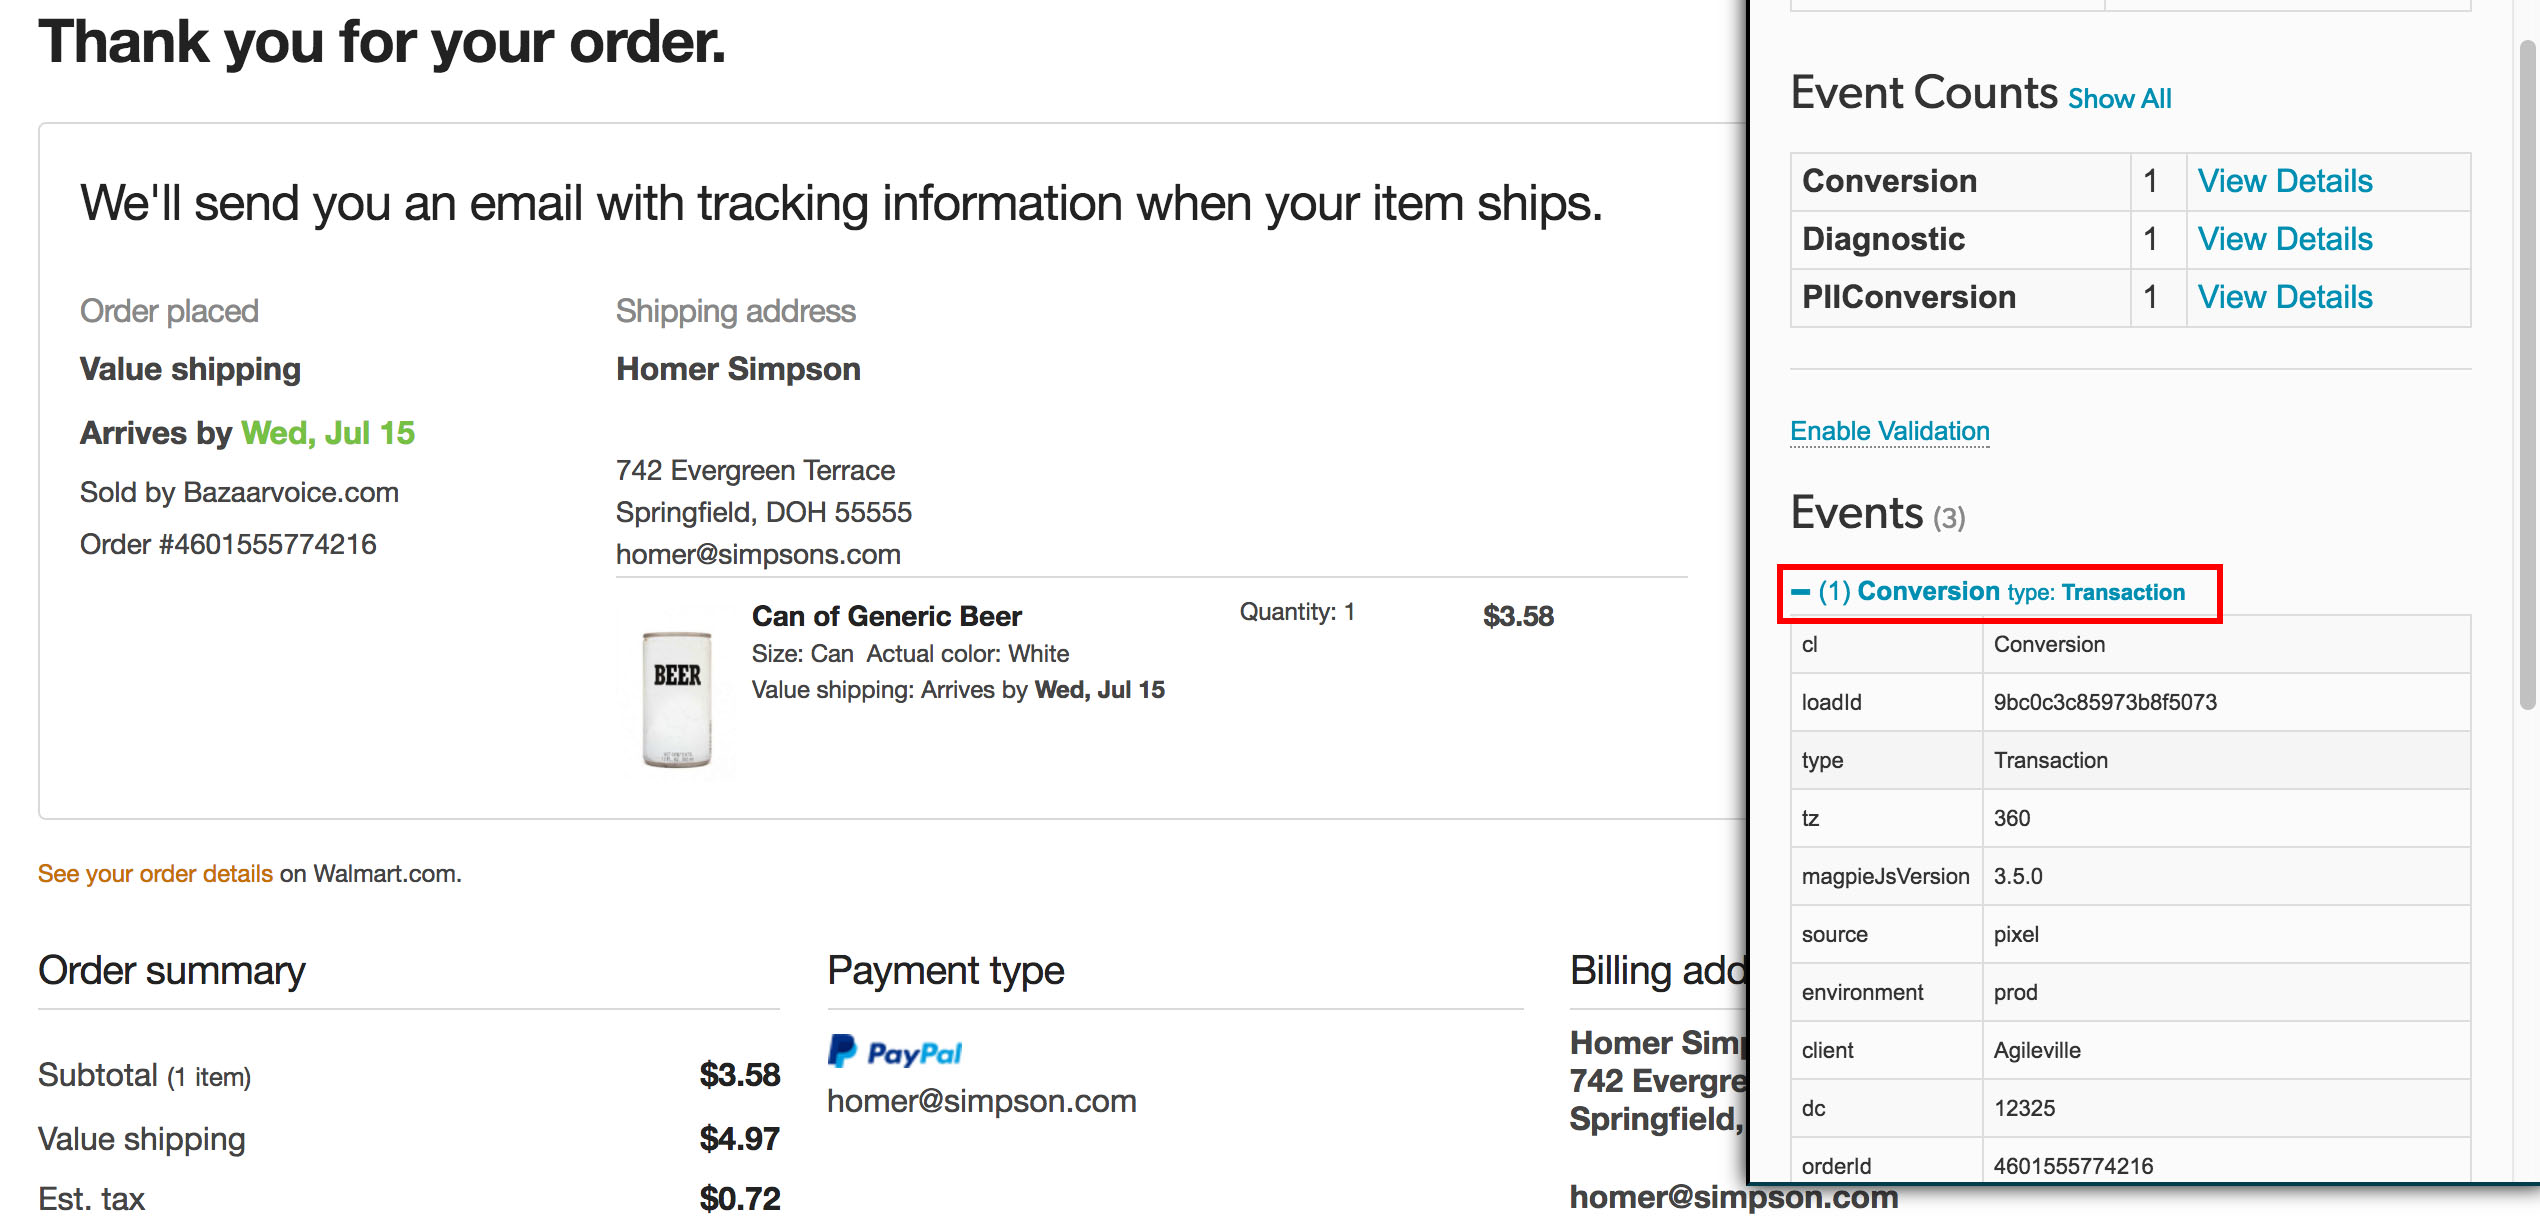
Pages or paths, representing conversion and/or transaction, can also be checked with the Bazaarvoice Analytics Inspector for Chrome. When that action is completed (e.g. loading the order confirmation page), you may notice an event with the type of "transaction" or "conversion" documented. Expand the event and you can see the additional parameters and values that are passed.
Summary
The Bazaarvoice Analytics Inspector for Chrome provides clients an immediate visual of the values that are being captured on pages where the BV pixel is found. Missing required parameter are also surfaced and visible in the extension.
Verify in the Bazaarvoice Workbench
After BV Pixel data is collected, some of that data can be viewed in the Bazaarvoice Workbench. By selecting specific dates and time ranges of transactions, reports are generated. Be aware, though, that transactions are
not available in the Workbench for at least two hours after the transaction completion.
To see the BV Pixel / PIE tag testing:
- From the workbench, select Settings » Configuration Settings: BV Pixel / PIE event Testing.
- Select a date and time range for the requested data.
Shorter time ranges returns faster results. Bazaarvoice recommends a range of no more than four hours. Also, be aware that the time range uses Greenwich Mean Time (GMT). Based on the time zone associated with your data, you may need to convert to GMT.
- Select the conversion type:
- All conversions
- PII conversions—Conversions containing personally identifiable information (PII)
- Non-PII conversions—Conversions that do not contain PII
- Click Read data.
You can review records from transaction data in the tables with field names and values. The following colors indicate the availability of data:
- Red —A required field is empty. The absence of this information affects the accuracy of ROI measurements and conversions based on transactions.
- Orange —A recommended field is empty. Including this information increases the precision of ROI measurements and the chances of conversion rate success.
- Green —Required or recommended fields are populated with data.
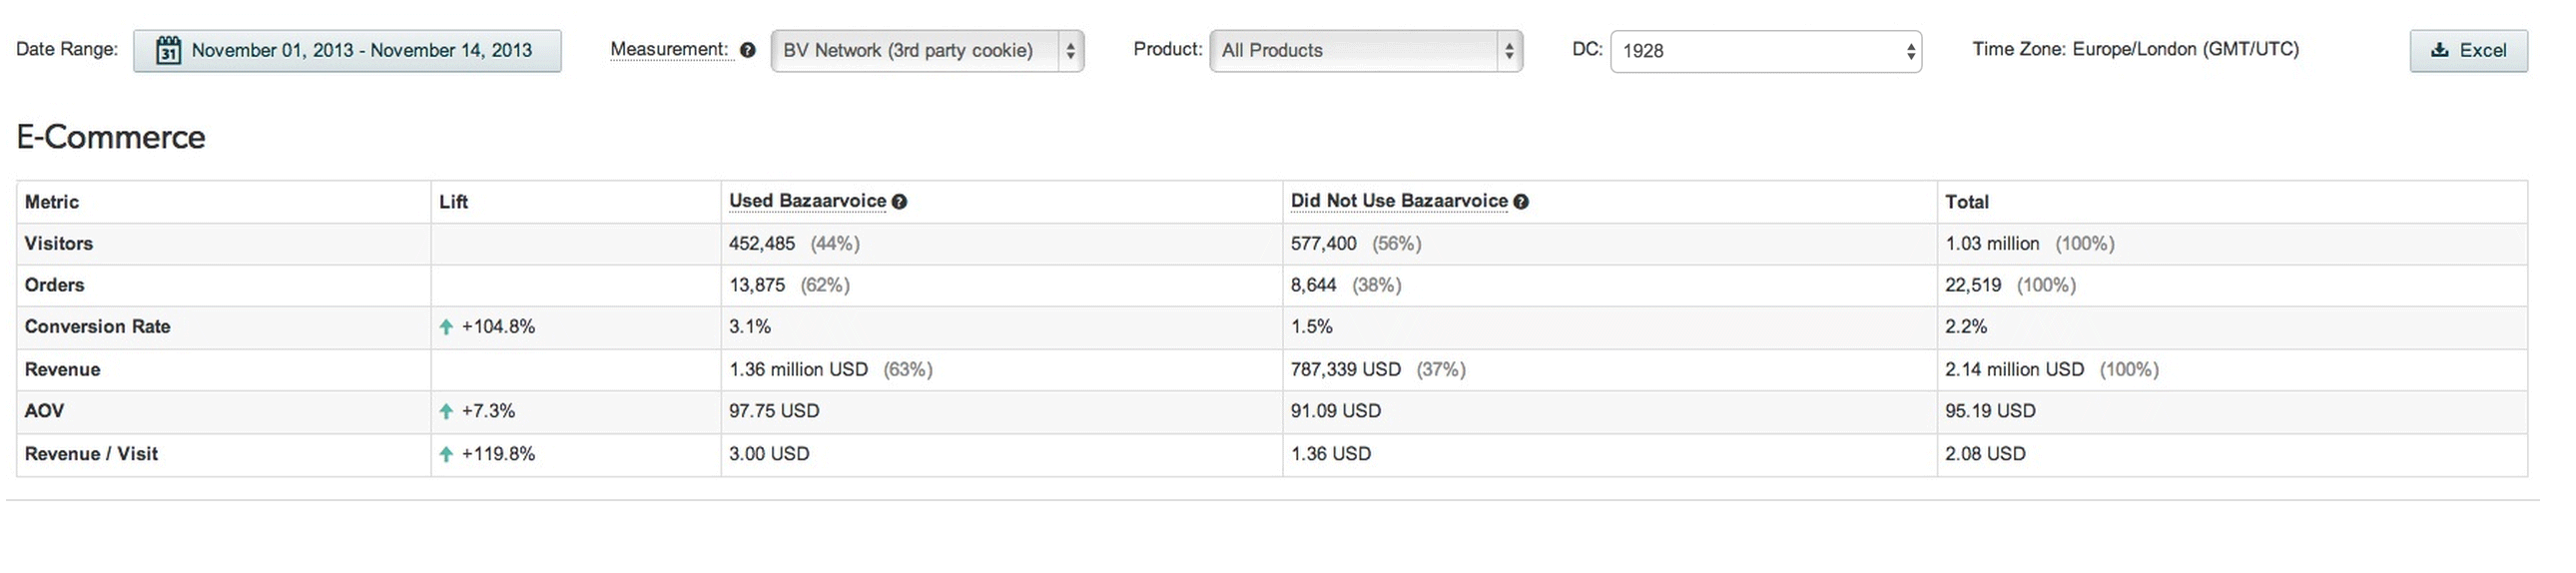
Conversion Impact Report (CIR)
When data is being collected, you are able to filter and query reports for different time periods and products. If there is no data being collected, a message is displayed with instructions on how to set up the report.
Note that captured data is not immediately available. The typical time for data to populate into the Conversion Impact Report is 24 hours.
- From the workbench, hover over Reports.
- Select the Conversion Impact Report option.
- Interact with the report to change the various filters.
Updated 3 months ago